


Bone oedema and sclerosis are two key responses of bone to injury or mechanical overload, but each presents unique challenges for diagnosis and management. Advances in 3-dimensional imaging – particularly MRI and CT – have greatly improved our ability to detect subtle bone changes that may not be visible on standard X-rays. This is especially important for racehorses, where early identification of bone stress or injury can prevent devastating outcomes. In this article, Chrysanthi Pitaouli explores when to use each modality and what these findings mean for equine athletes. For all you need to know about understanding bone oedema, read on…
What is bone oedema?
Bone oedema – also called bone oedema-like lesions, bone-marrow oedema, bone bruising, or bone contusions – was first described in human medicine for some patients who experienced significant joint pain even when their radiographs appeared normal [1]. Today, a bone oedema-like lesion is understood as an umbrella term for a variety of microscopic changes in which the normal fat within spongy (trabecular) bone is replaced by fluid. This shift can result from several pathological processes, including microdamage to trabeculae, haemorrhage, necrosis, inflammation, fibrosis, subchondral bone injury, fracture, stress fracture, infarct, tumour and bone oedema [2], [3], [4], [5]. In other words, bone oedema does not describe a single disease, but rather a common biological response to injury, overload, or pathology within bone.

Bone oedema: an early response to mechanical stress
What makes these lesions clinically important is that they are frequently associated with pain, even in the absence of obvious trauma, and may represent an early skeletal response to abnormal loading or stress [5], [6]. In horses, such lesions have been described when radiographs were unremarkable, and lameness has been localised to the distal limb [7], [8]. Interestingly, bone oedema-like lesions have also been reported in asymptomatic human athletes [9], so their significance must always be interpreted in context.
However, many of these changes tend to occur in specific high-load regions of joints that are already known to be vulnerable to injury [10], [11], [12]. As such, bone oedema-like lesions may represent the earliest detectable response of the skeleton to mechanical stress [7]. In horses, resolution of bone oedema-like lesions has often been observed to correlate with improvement in clinical signs, although this relationship is not consistently seen in human medicine [13].
Understanding Sclerosis
Sclerosis, also referred to as bone densification or desertification, describes a biological response in which trabecular bone becomes abnormally dense due to increased mineral deposition and reduced marrow space. It is characterised by the replacement of normal spongy bone with thickened, mineral-rich trabeculae, resulting in a stiffer and more brittle architecture. This process is part of the bone’s natural adaptation to repeated mechanical loading and is widely recognised in both clinical and research settings [14], [15].
Sclerosis develops when cyclical strain and microdamage stimulate bone-forming cells to lay down new mineralised matrix, a process known as bone modelling [16], [17]. At the same time, sustained mechanical loading suppresses bone resorption, leading to an imbalance where microdamage accumulates faster than it can be removed and repaired [18]. This creates a loop where the bone becomes denser in response to stress, but less able to flex and absorb further loading.
Over time, this increased stiffness may lead to a redistribution of forces to surrounding areas, where normal bone has not adapted in the same way. This uneven loading pattern raises the risk of stress-related injury, particularly if workload intensity remains high without appropriate rest or adaptation. Experimental studies have shown that microdamage and densification can reduce bone’s mechanical resilience, making it more susceptible to crack propagation and structural fatigue [19].
Importantly, sclerosis is not inherently pathological—it can reflect a normal physiological adaptation—but when bone is repeatedly overloaded beyond its capacity to remodel safely, this densification may act as an early warning sign of developing injury [20], [21].
Bone oedema: what MRI can detect
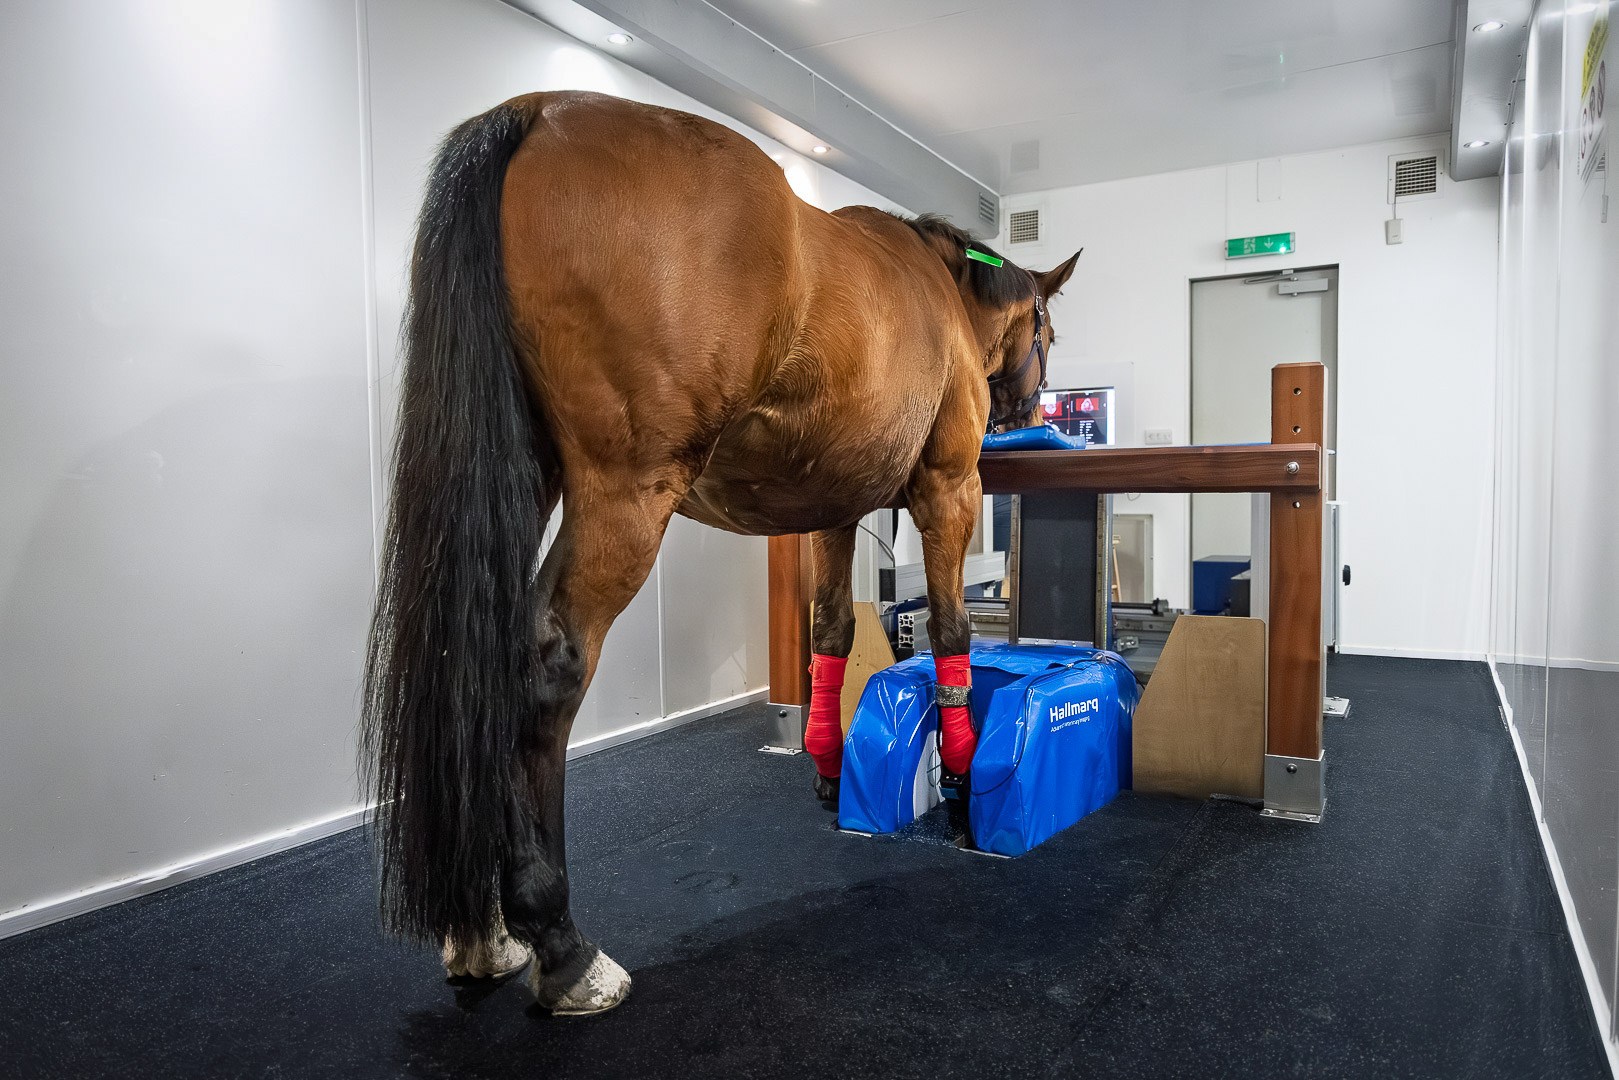
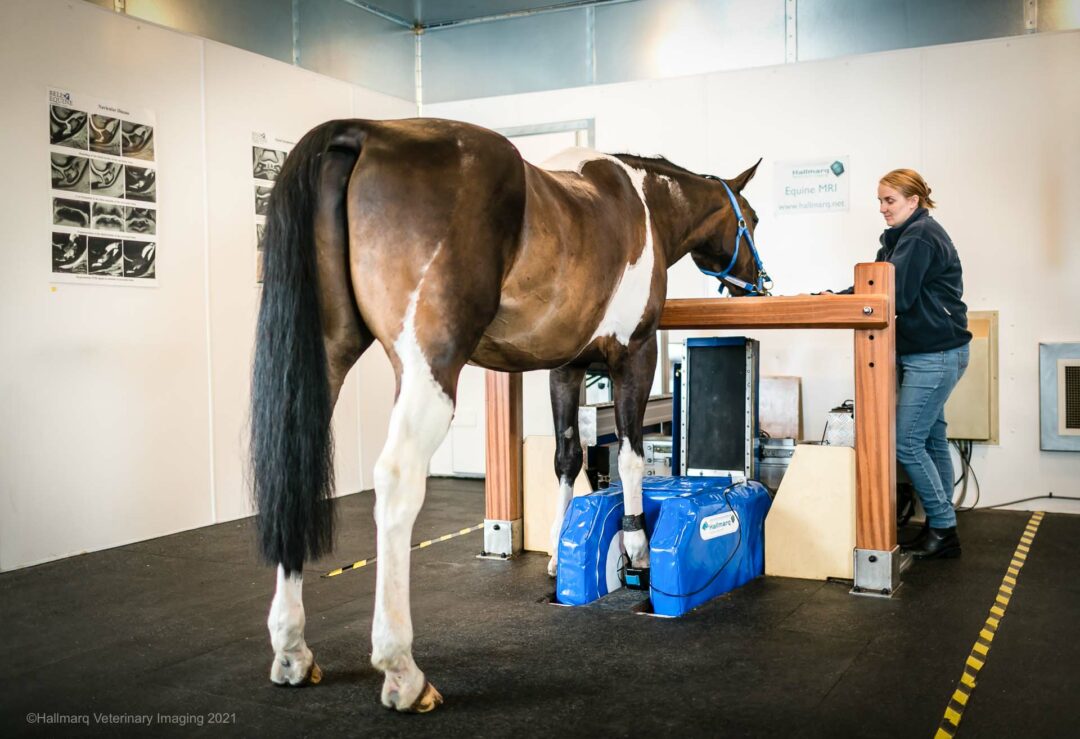
Magnetic resonance imaging (MRI) is considered the gold standard for detecting bone oedema-like lesions in live horses, which are an early indicator of bone response to loading or injury [22], [23], [24]. MRI works by detecting differences in the make-up of tissues, particularly their water and fat content. It uses different types of scans, called sequences, to highlight specific features depending on what we are looking for.
Bone oedema and the MRI STIR sequence
In equine orthopaedics, the most commonly used sequences include T1-weighted, T2-weighted, gradient echo (T2*), and STIR (Short Tau Inversion Recovery). Each sequence shows bone and soft tissue in a different way. T1-weighted images give good anatomical detail, while T2-weighted and T2*-weighted images make fluid-containing tissues appear brighter. STIR sequences go a step further by removing the fat signal entirely, which makes even small amounts of fluid in the bone stand out clearly [13].
Bone oedema-like lesions are best seen using the STIR sequence, which is specially designed to highlight fluid in the bone. These lesions appear as bright (high-signal) areas on STIR images because they contain more water than normal fatty marrow (which appears dark). On other sequences like T1-weighted images, they appear darker than the surrounding bone because of the loss of fat [22], [25].
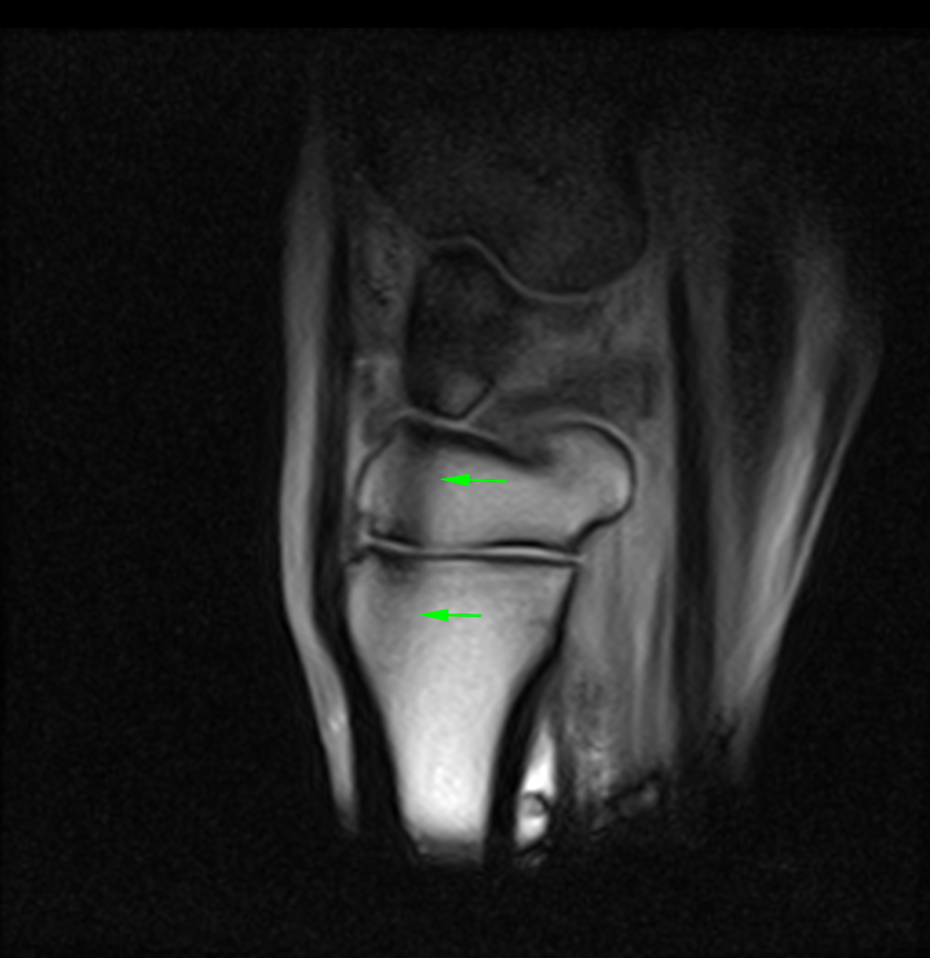
Recent research [50] highlights how bone oedema-like lesions can occur in specific, high-load attachment sites. Cavallier et al. (2025) described oedema-like signal changes at the enthesis of the distal interphalangeal joint (DIPJ) collateral ligaments. These lesions appeared as areas of hyperintense signal on STIR MRI sequences, even when the ligaments themselves looked structurally normal, and were associated with lameness. This finding reinforces the idea that bone oedema may reflect early or subtle mechanical overload, detectable only through advanced imaging, and not always accompanied by gross tissue damage.
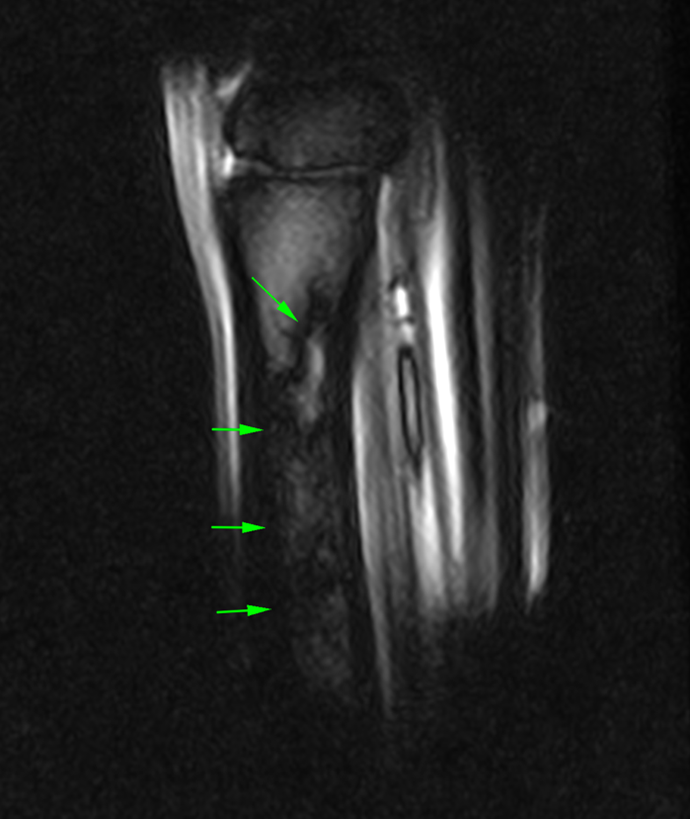
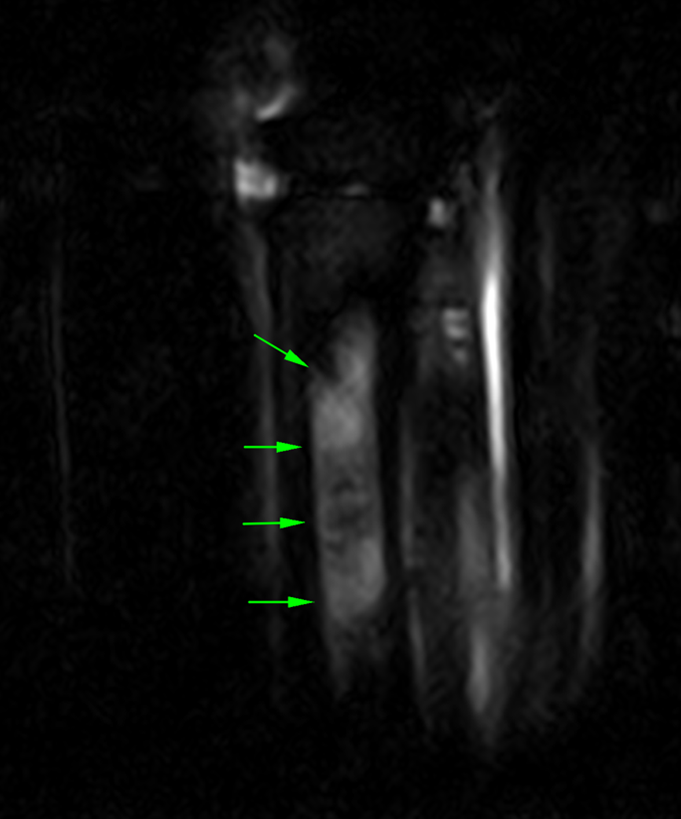
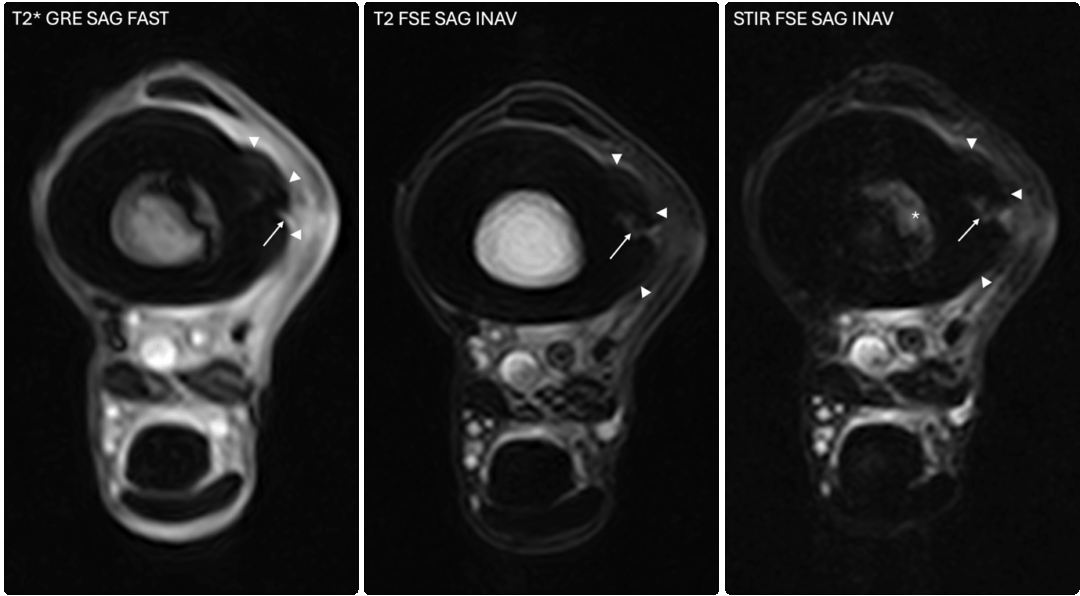
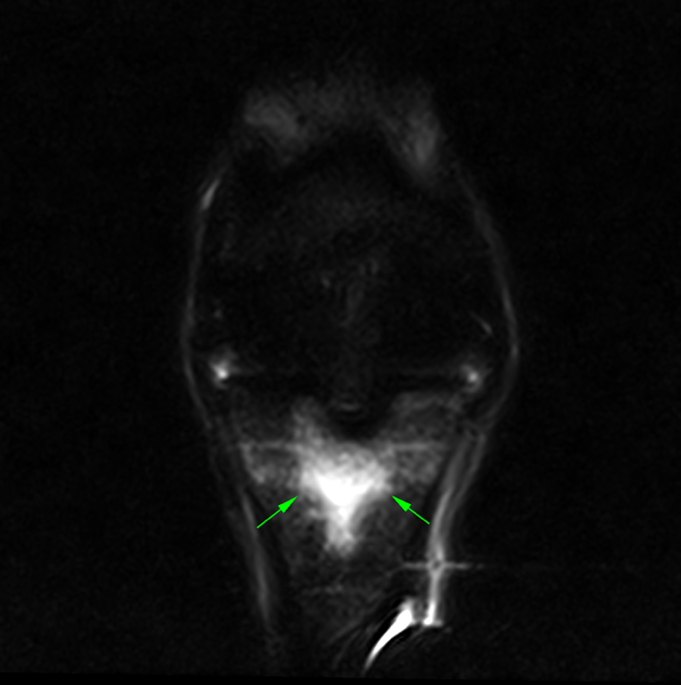
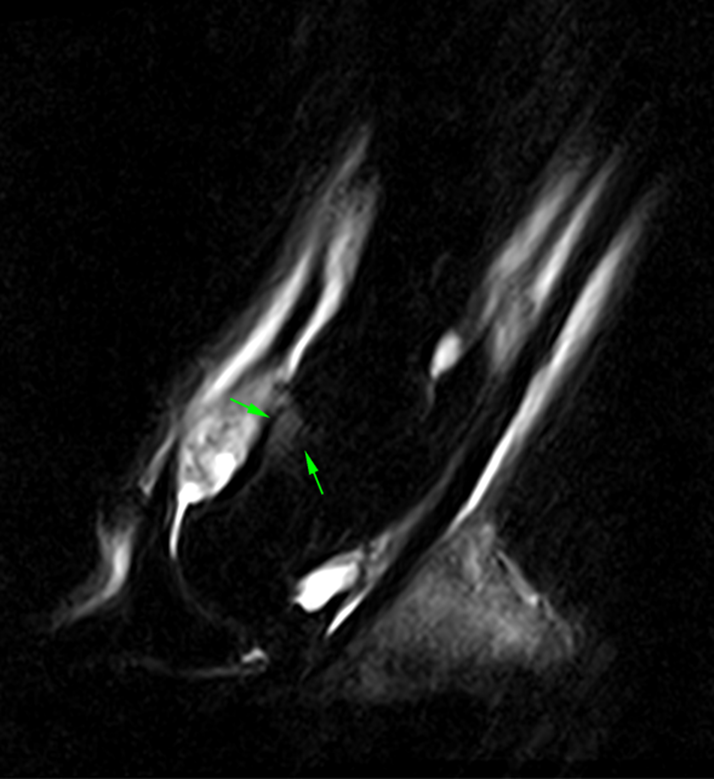
The images above show T2*W and STIR sagittal MRI images of the proximal metacarpal region (dorsal is on the left) showing the marked presence of fluid signal in the proximal metacarpal region and the metacarpal medulla.
The images below show repeat T2*W and STIR sagittal MRI images of the proximal metacarpal region (dorsal is on the left) acquired six months after the original injury showing complete resolution of the bone oedema-like signal


What makes STIR so useful is its ability to suppress the normal fat signal in bone, allowing even small amounts of fluid to stand out clearly. As mentioned earlier, this fluid can be associated with inflammation, bruising, or early bone injury. Because these changes cannot be seen on radiographs or CT, MRI remains the most reliable method for detecting them at an early stage [25], [26].

MRI for when oedema and sclerosis are both present
In contrast, sclerosis (or densification) appears in MRI dark (low-signal) across all sequences (T1, T2, and STIR) [27]. This occurs because mineralised bone contains very little water or fat and therefore returns almost no signal. While sclerosis can also be assessed by CT (which measures bone mineral density directly), MRI provides valuable additional information by showing whether sclerosis exists alone, or alongside oedema—suggesting active stress in bone that has already started to adapt. Recognising the presence of both oedema and sclerosis together can help distinguish between early, potentially reversible changes and longer-term bone adaptation or overload.
Bone oedema: what CT can detect
Computed tomography (CT) uses X-rays—like conventional radiography—but reconstructs them into high-resolution, three-dimensional images. Because it shows bone in cross-section, CT can reveal structural changes that a two-dimensional radiograph often misses, including trabecular micro-cracks, areas of increased density (sclerosis), and areas of decreased density (bone resorption) associated with repetitive loading [28], [29], [30], [31], [32]. For these reasons CT is widely regarded as the gold standard for imaging bone and remains the most accurate method for measuring bone-mineral density and mapping mineral distribution patterns [32], [33].
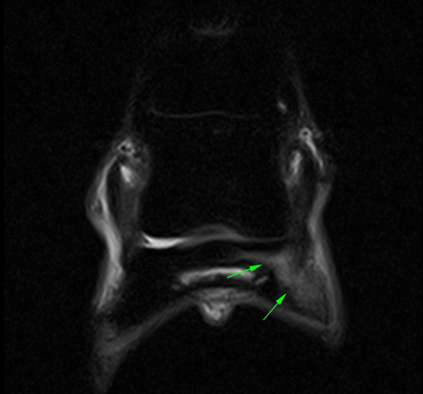
CT images of the fetlock (below) clearly demonstre a subtle subchondral lucency at the articular surface.
(Images courtesy of Elisabetta Giorio).

However, CT cannot detect bone-oedema-like lesions, because it does not capture changes in water content or marrow composition. Whereas MRI can visualise fluid accumulation and early inflammatory responses, CT only reflects structural or mineralised change. In other words, CT excels at showing what the bone looks like today—whether it has remodelled, cracked, or stiffened—but not how it is reacting at a tissue level before those changes become permanent.
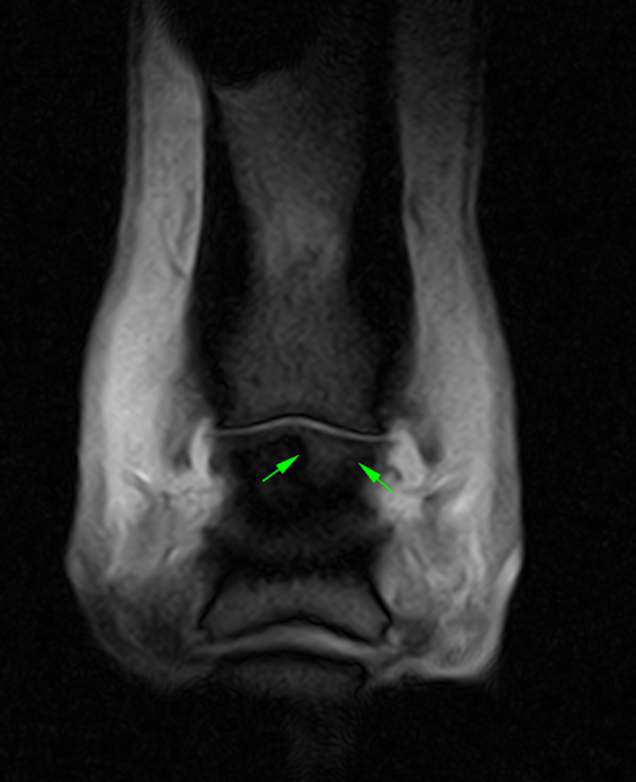
The CT images below show severe collapse of the dorsomedial aspect of the distal interphalangeal joint.

While still in the early stages of development, dual-energy CT (DECT) shows potential as a future tool for detecting fluid accumulation in bone (bone oedema-like signal). Although it has been tested both in live horses and in post-mortem specimens, the technique still requires further refinement, as there are a few possible limitations. Nonetheless, it may one day offer an alternative means of identifying the same types of bone changes currently seen with MRI [34], [35].
Racehorse imaging: screening tools and injury risk management
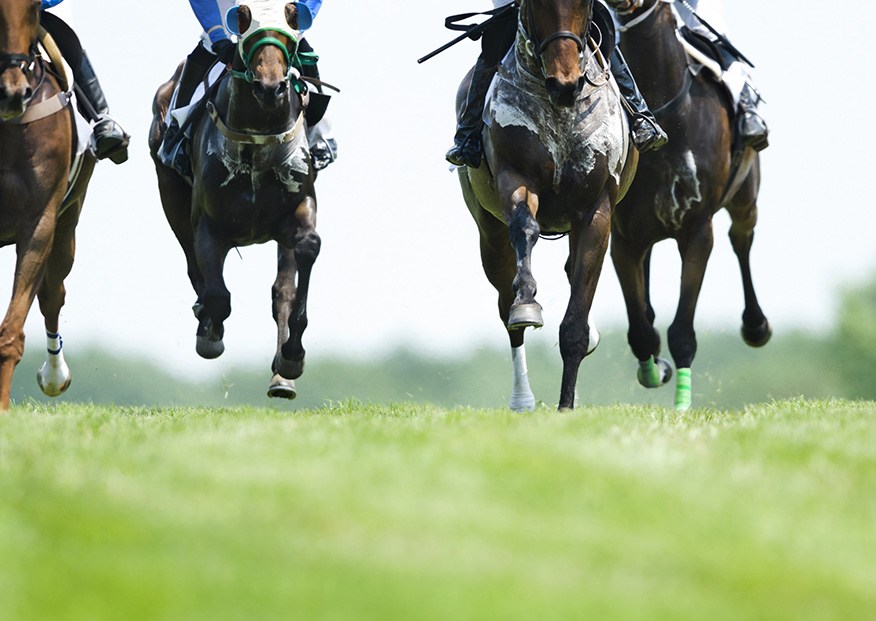
The welfare of Thoroughbred racehorses remains a central concern across the industry, particularly due to the risk of catastrophic injuries and their implications not only for the horse but also for jockey safety. The need to identify horses at risk of serious musculoskeletal injuries before they occur is more pressing than ever. While accidental trauma will always be a part of high-speed racing, there is broad agreement that injury rates should be kept as low as the best global standards.
In the UK, lateral condylar fractures of the third metacarpal bone (MC3) are the leading cause of on-track euthanasia in racehorses [36], [37], whereas in the US, proximal sesamoid bone fractures are the most common fatal injury [38], [39]. Many of these injuries stem from cumulative fatigue to the subchondral bone and can evolve silently over weeks or months before crossing a mechanical threshold and resulting in a sudden fracture [40].
Early detection is key—but conventional imaging tools often fall short. Radiography and ultrasonography can be inconclusive when evaluating fetlock pain and subchondral stress injuries. Scintigraphy, while helpful in some cases, is limited by its relatively low spatial resolution and suboptimal sensitivity and specificity. Positron emission tomography (PET) has shown potential for fracture risk screening [41], but it is not used as a standalone tool and is typically integrated with other advanced imaging techniques [42].
MRI for sensitive screening
For a screening tool to be truly useful in a high-stakes environment like racing, it must be highly sensitive to avoid missing horses at risk of serious injury (false negatives), while also being specific enough not to wrongly exclude sound horses from training or competition (false positives). An ineffective balance between the two can lead to either unnecessary scratching of fit horses—or worse, missed opportunities to prevent injury.

Currently, radiography remains the most widely used modality for screening, especially for detecting early fatigue-related changes such as altered bone density in the parasagittal groove of the MC3 condyle [43]. However, in many horses, radiographs fail to reveal subtle or early pathology [29], and the consequences of a missed lesion can be devastating. The increasing availability of 3-dimensional imaging, such as MRI and CT, has provided improved detection of subtle bone injury, particularly in the early stages of subchondral fatigue, where conventional techniques may fall short [42].
Modality selection: a clinical decision based on timing and context
The question is not simply whether MRI or CT is better, but when and why we image a horse in the first place. Ideally, both techniques should be used in combination: MRI can detect early physiological changes such as bone marrow oedema, while CT is more suited to evaluating structural changes like subchondral bone sclerosis and lysis. Unfortunately, practical constraints—cost, time, and access—often make it difficult to perform both.
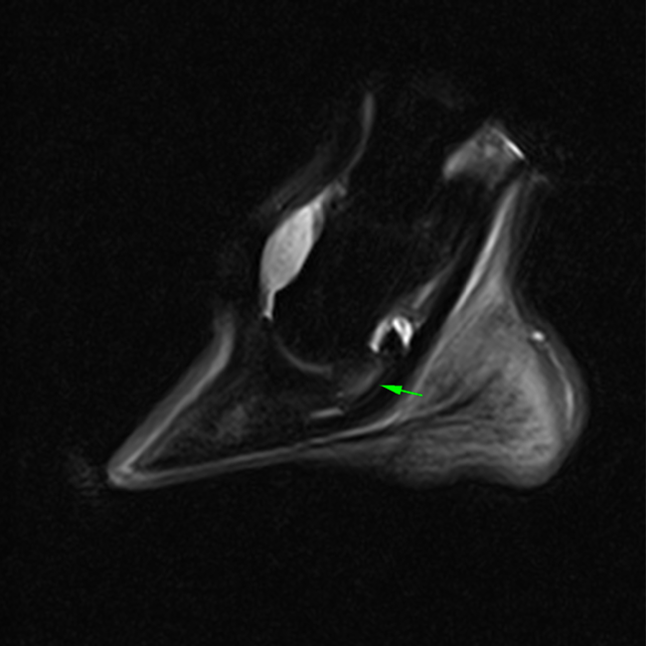
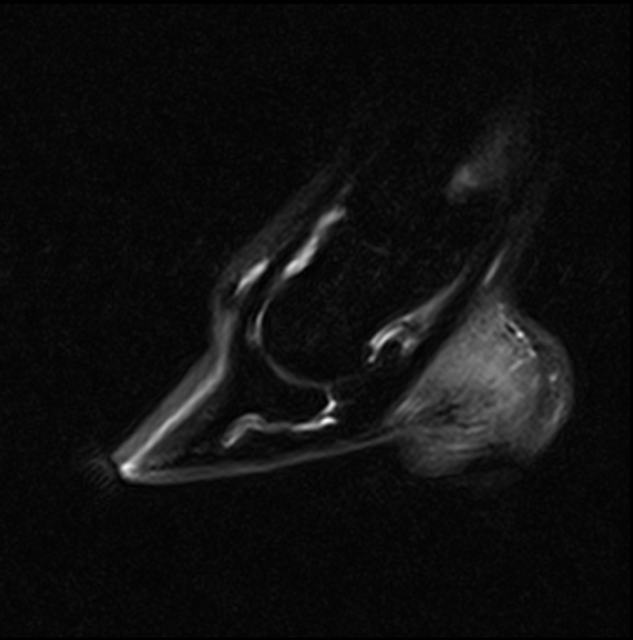
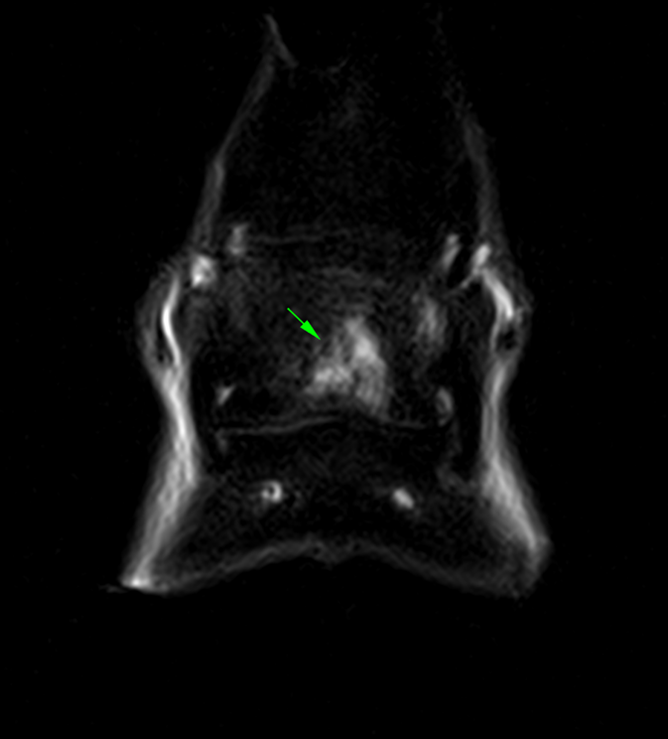
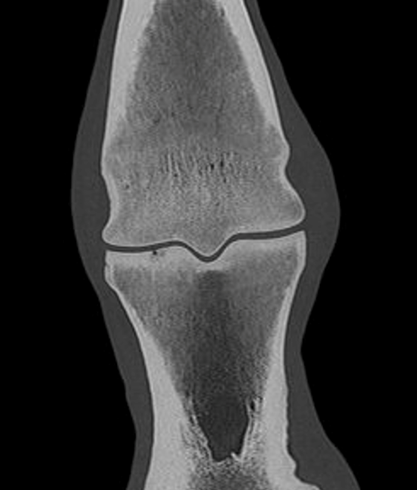
The STIR sagittal (left) and T2*W (right) frontal MRI images above, show an area of bone oedema-like signal of the middle phalanx. In contrast, CT images (below) of the same horse demonstrate a small osteochondral fragment at the same location.


When a clear fracture is visible—either as a radiolucent line on radiography or CT, or as a fluid-filled cortical breach on MRI—the diagnosis is straightforward: the horse must stop training. But many cases are less clear-cut. Fatigue injuries often produce subtle, non-specific findings, and in some instances, significant pre-fracture pathology may be present without any detectable clinical signs [37], [44]. This uncertainty highlights the importance of longitudinal studies and a careful understanding of the biological context behind imaging findings.
MRI offers the advantage of detecting changes weeks before they appear on radiographs and provides both structural and functional information, including identification of bone oedema-like lesions that may reflect an early stress response [24], [45], [46], [47]. It is also particularly useful for assessing healing and monitoring the progression or resolution of osseous lesions over time, as resolution of bone oedema-like lesions can often be correlated with clinical improvement [13].However, its lower spatial resolution must be taken into account [46].
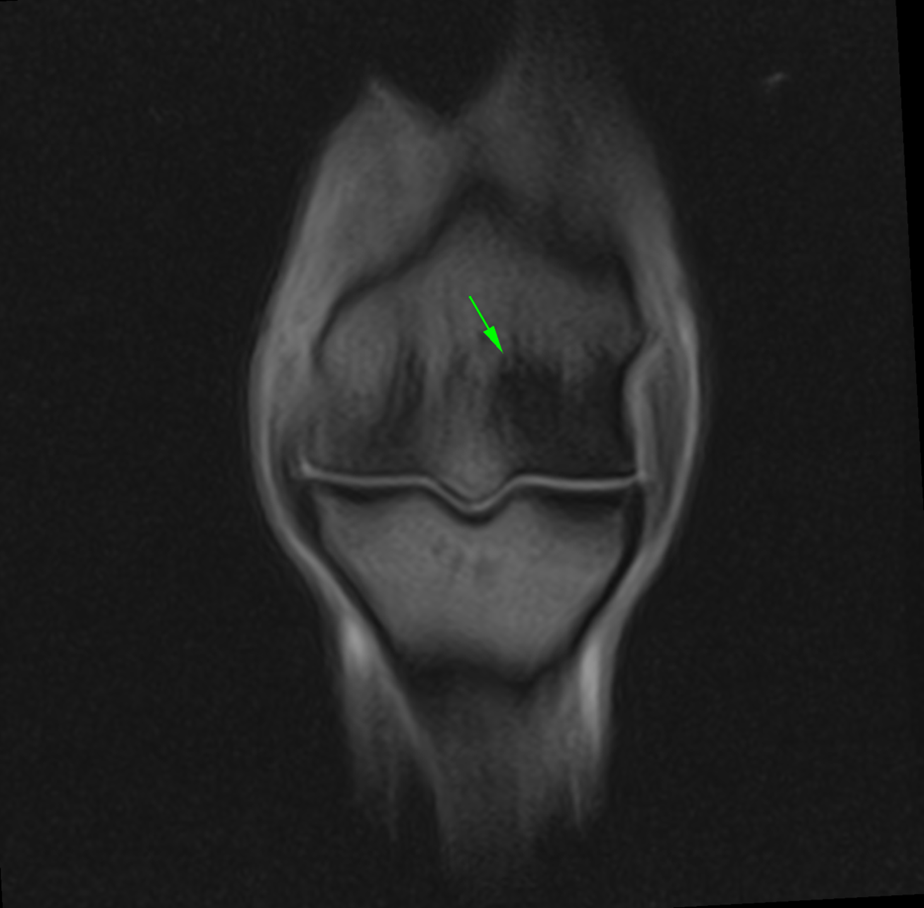
The STIR frontal MRI images of the foot (below) show progressive resolution of bone oedema-like signal associated with a distal phalanx fracture. Scans are arranged chronologically from oldest (left) to most recent (right).


CT, on the other hand, has been successfully used as a pre-race screening tool [39], [48], [44], [49]. It provides excellent detail for evaluating bone density and detecting focal lesions that have been associated with an increased risk of condylar fracture in post-mortem studies. But CT alone cannot reveal functional changes within bone, and its sensitivity for early-stage pathology can be limited [45].
The CT images (below) demonstrate a subtle subchondral lucency at the articular surface of the middle phalanx (Images courtesy of Elisabetta Giorio).


Conclusion
In understanding bone oedema, ultimately, there’s no one-size-fits-all approach. For early detection or assessing lesion healing, MRI may offer greater value. For short-term fracture risk assessment before a race, CT may provide clearer answers about structural integrity. The optimal approach likely involves both modalities where possible, but veterinarians must weigh clinical context, horse history, and practical limitations.
These considerations are particularly relevant in the high-performance environment of racehorses. In sport horses and leisure animals, the clinical priorities, expectations, and imaging strategies may differ. Each case is unique, and decisions should always be made in consultation with the attending veterinarian.
References
[1] Wilson, A.J., Murphy, W.A., Hardy, D.C. and Totty, W.G., 1988. Transient osteoporosis: transient bone marrow edema?. Radiology, 167(3), pp.757-760.
[2] Tucker, R.L. and Sande, R.D., 2001. Computed tomography and magnetic resonance imaging in equine musculoskeletal conditions. Veterinary Clinics of North America: Equine Practice, 17(1), pp.145-157.
[3] Murray, R. and Mair, T., 2005. Use of magnetic resonance imaging in lameness diagnosis in the horse. In practice, 27(3), pp.138-146.
[4] Murray, R.C., Blunden, T.S., Schramme, M.C. and Dyson, S.J., 2006. How does magnetic resonance imaging represent histologic findings in the equine digit?. Veterinary Radiology & Ultrasound, 47(1), pp.17-31.
[5] Zanetti, M., Bruder, E., Romero, J. and Hodler, J., 2000. Bone marrow edema pattern in osteoarthritic knees: correlation between MR imaging and histologic findings. Radiology, 215(3), pp.835-840.
[6] Zanetti, M., Steiner, C.L., Seifert, B. and Hodler, J., 2002. Clinical outcome of edema-like bone marrow abnormalities of the foot. Radiology, 222(1), pp.184-188.
[7] Mizobe, F., Nomura, M., Ueno, T. and Yamada, K., 2019. Bone marrow oedema-type signal in the proximal phalanx of Thoroughbred racehorses. Journal of Veterinary Medical Science, 81(4), pp.593-597.
[8] Olive, J., Mair, T.S. and Charles, B., 2009. Use of standing low‐field magnetic resonance imaging to diagnose middle phalanx bone marrow lesions in horses. Equine Veterinary Education, 21(3), pp.116-123.
[9] Trappeniers, L., De Maeseneer, M., De Ridder, F., Machiels, F., Shahabpour, M., Tebache, C., Verhellen, R. and Osteaux, M., 2003. Can bone marrow edema be seen on STIR images of the ankle and foot after 1 week of running?. European journal of radiology, 47(1), pp.25-28.
[10] Bani Hassan, E., Mirams, M., Mackie, E.J. and Whitton, R.C., 2017. Prevalence of subchondral bone pathological changes in the distal metacarpi/metatarsi of racing Thoroughbred horses. Australian Veterinary Journal, 95(10), pp.362-369.
[11] Whitton, R.C., Ayodele, B.A., Hitchens, P.L. and Mackie, E.J., 2018. Subchondral bone microdamage accumulation in distal metacarpus of Thoroughbred racehorses. Equine veterinary journal, 50(6), pp.766-773.
[12] Heales, C.J., Summers, I.R., Fulford, J., Knapp, K.M. and Winlove, C.P., 2019. Investigation of changes in bone density and chemical composition associated with bone marrow oedema-type appearances in magnetic resonance images of the equine forelimb. BMC Musculoskeletal Disorders, 20, pp.1-10.
[13] Murray, R.C. ed., 2010. Equine MRI. John Wiley & Sons.
[14] Firth, E.C., 2006. The response of bone, articular cartilage and tendon to exercise in the horse. Journal of anatomy, 208(4), pp.513-526.
[15] Kawcak, C.E., McIlwraith, C.W. and Firth, E.C., 2010. Effects of early exercise on metacarpophalangeal joints in horses. American journal of veterinary research, 71(4), pp.405-411.
[16] Riggs, C.M. and Boyde, A., 1999. Effect of exercise on bone density in distal regions of the equine third metacarpal bone in 2‐year‐old Thoroughbreds. Equine veterinary journal, 31(S30), pp.555-560.
[17] Whitton, R.C., Trope, G.D., Ghasem-Zadeh, A., Anderson, G.A., Parkin, T.D., Mackie, E.J. and Seeman, E., 2010. Third metacarpal condylar fatigue fractures in equine athletes occur within previously modelled subchondral bone. Bone, 47(4), pp.826-831.
[18] Whitton, R.C., Mirams, M., Mackie, E.J., Anderson, G.A. and Seeman, E., 2013. Exercise-induced inhibition of remodelling is focally offset with fatigue fracture in racehorses. Osteoporosis International, 24, pp.2043-2048.
[19] Malekipour, F., Hitchens, P.L., Whitton, R.C. and Lee, P.V.S., 2022. Effects of in vivo fatigue-induced microdamage on local subchondral bone strains. Journal of the Mechanical Behavior of Biomedical Materials, 136, p.105491.
[20] Frost, H.M., 2003. Bone’s mechanostat: a 2003 update. The Anatomical record part a: discoveries in molecular, cellular, and evolutionary biology: an official publication of the american association of anatomists, 275(2), pp.1081-1101.
[21] Martig, S., Hitchens, P.L., Stevenson, M.A. and Whitton, R.C., 2018. Subchondral bone morphology in the metacarpus of racehorses in training changes with distance from the articular surface but not with age. Journal of anatomy, 232(6), pp.919-930.
[22] Dyson, S.J., Murray, R. and Schramme, M.C., 2005. Lameness associated with foot pain: results of magnetic resonance imaging in 199 horses (January 2001‐December 2003) and response to treatment. Equine veterinary journal, 37(2), pp.113-121.
[23] Schett, G., 2009. Bone marrow edema. Annals of the New York Academy of Sciences, 1154(1), pp.35-40.
[24] Datir, A.P., Saini, A., Connell, D. and Saifuddin, A., 2007. Stress-related bone injuries with emphasis on MRI. Clinical radiology, 62(9), pp.828-836.
[25] Kapelov, S.R., Teresi, L.M., Bradley, W.G., Bucciarelli, N.R., Murakami, D.M., Mullin, W.J. and Jordan, J.E., 2003. Bone contusions of the knee: increased lesion detection with fast spin-echo MR imaging with spectroscopic fat saturation. Radiology, 189(3), pp.901-904.
[26] Dyson, S.J. and Murray, R., 2006. Osseous trauma in the fetlock region of mature sports horses.
[27] Dyson, S. and Murray, R., 2007. Magnetic resonance imaging of the equine foot. Clinical techniques in equine practice, 6(1), pp.46-61.
[28] Brünisholz, H.P., Hagen, R., Fürst, A.E. and Kuemmerle, J.M., 2015. Radiographic and computed tomographic configuration of incomplete proximal fractures of the proximal phalanx in horses not used for racing. Veterinary surgery, 44(7), pp.809-815.
[29] Morgan, J.W., Santschi, E.M., Zekas, L.J., SCOLLAY‐WARD, M.C., Markel, M.D., Radtke, C.L., Sample, S.J., Keuler, N.S. and Muir, P., 2006. Comparison of radiography and computed tomography to evaluate metacarpo/metatarsophalangeal joint pathology of paired limbs of thoroughbred racehorses with severe condylar fracture. Veterinary Surgery, 35(7), pp.611-617.
[30] Tóth, P., Horváth, C., Ferencz, V., Tóth, B., Váradi, A., Szenci, O. and Bodó, G., 2013. Bone mineral density (BMD) and computer tomographic measurements of the equine proximal phalanx in correlation with breaking strength. Polish journal of veterinary sciences.
[31] Boyde, A., 2021. The bone cartilage interface and osteoarthritis. Calcified Tissue International, 109(3), pp.303-328.
[32] Olive, J., D’ANJOU, M.A., Alexander, K., Laverty, S. and Theoret, C., 2010. Comparison of magnetic resonance imaging, computed tomography, and radiography for assessment of noncartilaginous changes in equine metacarpophalangeal osteoarthritis. Veterinary radiology & ultrasound, 51(3), pp.267-279.
[33] Waite, K.L., Nielsen, B.D. and Rosenstein, D.S., 2000. Computed tomography as a method of estimating bone mineral content in horses. Journal of Equine Veterinary Science, 20(1), pp.49-52.
[34] Germonpré, J., Vandekerckhove, L.M., Raes, E., Chiers, K., Jans, L. and Vanderperren, K., 2024. Post-mortem feasibility of dual-energy computed tomography in the detection of bone edema-like lesions in the equine foot: a proof of concept. Frontiers in Veterinary Science, 10, p.1201017.
[35] Germonpré, J., Lorenz, I., Vandekerckhove, L.M., Duchateau, L., Diekhoff, T. and Vanderperren, K., 2025. Dual-Energy Computed Tomography for the Detection of Bone Edema-Like Lesions in the Equine Foot: Standing Horses and Cadaveric Specimens. Veterinary Sciences, 12(7), p.614.
[36] Johnson, B.J., Stover, S.M., Daft, B.M., Kinde, H., Read, D.H., Barr, B.C., Anderson, M., Moore, J., Woods, L., Stoltz, J. and Blanchard, P., 1994. Causes of death in racehorses over a 2 year period. Equine Veterinary Journal, 26(4), pp.327-330.
[37] Wylie, C.E., McManus, P., McDonald, C., Jorgensen, S. and McGreevy, P., 2017. Thoroughbred fatality and associated jockey falls and injuries in races in New South Wales and the Australian Capital Territory, Australia: 2009–2014. The Veterinary Journal, 227, pp.1-7.
[38] Peloso, J.G., Vogler III, J.B., Cohen, N.D., Marquis, P. and Hilt, L., 2015. Association of catastrophic biaxial fracture of the proximal sesamoid bones with bony changes of the metacarpophalangeal joint identified by standing magnetic resonance imaging in cadaveric forelimbs of Thoroughbred racehorses. Journal of the American Veterinary Medical Association, 246(6), pp.661-673.
[39] Parkin, T.D.H., French, N.P., Riggs, C.M., Morgan, K.L., Clegg, P.D., Proudman, C.J., Singer, E.R. and Webbon, P.M., 2004. Risk of fatal distal limb fractures among thoroughbreds involved in the five tpes of racing in the United Kingdom. Veterinary Record, 154(16), pp.493-497.
[40] Muir, P. and Whitton, R.C., 2024. Injury prevention in Thoroughbred racehorses. Equine veterinary journal, 56(3), pp.386-388.
[41] Spriet, M., 2022. Positron emission tomography: a horse in the musculoskeletal imaging race. American Journal of Veterinary Research, 83(7).
[42] Spriet, M. and Vandenberghe, F., 2024. Equine nuclear medicine in 2024: use and value of scintigraphy and PET in equine lameness diagnosis. Animals, 14(17), p.2499.
[43] Ramzan, P.H.L., Palmer, L. and Powell, S.E., 2015. Unicortical condylar fracture of the Thoroughbred fetlock: 45 cases (2006–2013). Equine Veterinary Journal, 47(6), pp.680-683.
[44] Cresswell EN, McDonough SP, Palmer SE, Hernandez CJ, Reesink HL. Can quantitative computed tomography detect bone morphological changes associated with catastrophic proximal sesamoid bone fracture in Thoroughbred racehorses?. Equine veterinary journal. 2019 Jan;51(1):123-30.
[45] Spitz, D.J. and Newberg, A.H., 2002. Imaging of stress fractures in the athlete. Radiologic Clinics, 40(2), pp.313-331.
[46] Vanhoenacker, F.M. and Snoeckx, A., 2007. Bone marrow edema in sports: general concepts. European journal of radiology, 62(1), pp.6-15.
[47] Powell, S.E., 2012. Low‐field standing magnetic resonance imaging findings of the metacarpo/metatarsophalangeal joint of racing Thoroughbreds with lameness localised to the region: a retrospective study of 131 horses. Equine veterinary journal, 44(2), pp.169-177.
[48] Irandoust, S., O’Neil, L.M., Stevenson, C.M., Franseen, F.M., Ramzan, P.H., Powell, S.E., Brounts, S.H., Loeber, S.J., Ergun, D.L., Whitton, R.C. and Henak, C.R., 2025. Comparison of radiography and computed tomography for identification of third metacarpal structural change and associated assessment of condylar stress fracture risk in Thoroughbred racehorses. Equine Veterinary Journal, 57(3), pp.723-736.
[49] Denoix, J.M. and Coudry, V., 2020. Clinical insights: Imaging of the equine fetlock in Thoroughbred racehorses: Identification of imaging changes to predict catastrophic injury
[50] Cavallier, F., Cantatore, F., Marcatili, M. & Biggi, M. (2025) Bone oedema-like lesions at the enthesis of DIPJ collateral ligaments: MRI findings, management and outcome. Equine Veterinary Education, 37, e242–e247. Available from: https://doi.org/10.1111/eve.14183